
In the fast paced and data-centric world of business, Business Analyst Tools helps to perform a vital link between technology and company strategy.
They use a range of tools to derive insights, drive projects and share their findings with stakeholders.
With the increasing need for data based decision-making, BAs must possess a combination of tools that allow them to recoup effectiveness and competitiveness.
In this content, we will address the top business analyst tools on the market today by examining their features, benefits and uses; as well as why they are so important for your business in order to streamline operations.
If you are a top-tier business analyst or a novice trying to level up your game, this guide will give you some great ideas on the tools that can streamline your workflows.
Top Business Analyst Tools For BA’s
Microsoft Excel: The All-Rounder Tool
Microsoft Excel is one of the most widely used tools by business analysts that has incredible flexibility and power.
More advanced Excel offers strong data manipulation capabilities, making it a workhorse for working with data, building models and presenting output.
While more and more business intelligence (BI) solutions are coming out, with costly price tags often attached to them.
Excel has refused to go away, partly due its flexibility in use and ease of understanding.
Key Features of Microsoft Excel for Business Analysts:
- Analysis: With features such as pivot tables, VLOOKUP, INDEX/MATCH and conditional formatting in Excel, the ability to understand data is integral. Such tools allow analysts to sift, sort and summarize huge sets of data faster than ever before.
- Powerful formulas: Excel has more than 300 built-in formulas, allowing you to perform everything from simple arithmetic to complex financial models or statistical analysis.
- Visualization: Excel has a variety of visual aids such as charts, graphs and histogram that make the data more palatable for stakeholders.
- Macros: Excel offers a macro feature that can automate a set of tasks, resulting in saved time and consistency.
While there are more advanced tools for specific use cases, Microsoft Excel continues to be a default tool for business analytics.
Because it is flexible, intuitive, and can easily plug in with other Microsoft products, Power BI or Teams.
Tableau: For Advanced Data Visualization
Data Visualization has become a critical point in communicating insights clearly and effectively in the modern business space.
One of the top data visualization tools, Tableau helps analysts transform raw data into compelling, interactive dashboards and reports.
It enables integration with a wide range of data sources and is very flexible to be used in an array of business settings.
Key Features of Tableau for Business Analysts:
- Data Connectivity: Tableau is able to connect to multiple data sources, including spreadsheets, databases, cloud storage and web applications for smooth integration.
- Interactive Dashboards: Tableau gives you the power to develop interactive dashboards that your stakeholders can navigate, thus making smarter decisions.
- Drag-and-drop interface: The laymen will feel extremely comfortable by the lines of action that Tableau provides as it don’t require them to write a single line of code or even without knowing deep level technicalities one can start creating their visualizations.
- Real-Time Analytics: Tableau can analyze data in real-time, which is critical for businesses who require immediate insights to make decisions.
Business analysts employ Tableau not just to create reports, but also to track KPIs, identify trends and measure business results over time.
Being able to interface with lots of data sources is great for companies that have different technology stacks.
Power BI by Microsoft Business Intelligence
It is simple for both large and small enterprises to make decisions based on data with the Cloud-based solution known as Microsoft Power BI.
Power BI built by Microsoft is another great tool that can help raw data make sense and add more value in it.
Power BI is another business intelligence (BI) tool, also similar to Tableau, but with a strong connection to other Microsoft products (Azure, SharePoint and Office 365 are all integrated), it’s a good fit for businesses who already use some of the Microsoft ecosystem.
Key Features of Power BI for the Business Analysts:
- Connectivity: The ability to connect to a large selection of data sources, both on-premises and in the cloud (e.g., Google Analytics, Salesforce and Azure SQL).
- Data Modelling: In the sense of data modelling, Power BI provides strong capabilities to Model relationships between multiple datasets to improve the analysis and has broad applicability for analysts.
- Adaptable Reports: Transform business analysts into power users with ad hoc analysis and interactive reports, built using Power BI via intuitive, easy-to-use report.
- Natural Language Querying: Power BI’s “Q&A” feature allows for asking questions in simple English, so users can easily get back answers without having to master deep and complex query language.
The business analytics community has embraced Power BI because it’s affordable, easy to use, and integrates well with other Microsoft products
This is a particularly good option for companies who have made significant investments in the Microsoft ecosystem already.
Jira: Project Management Tool for Development Teams
And unlike Excel or Tableau, they do not concentrate on the business analysts’ needs when it comes to project progress tracking and management.
Jira was designed for agile project management and works well with BAs in software development or product management.

Key Features of Jira for Business Analysts:
- Agile Frameworks: Jira can be used to implement agile methodologies such as Scrum and Kanban, which allows BAs to organize sprints and monitor progress so the project stays on track.
- Issue Tracking: Jira helps in tracking all the tasks, bugs and issues which gives an insight about project bottlenecks while ensuring managerial step before timeline.
- Custom Dashboards: Jira provides custom dashboards with real-time data about project status, team performance and any bottlenecks you might run into.
- Collaboration: Jira helps to work with the team through sharing updates, assigning tasks and communicating directly from the platform.
For business analysts working on the project management front, Jira is a game-changing tool that can facilitate workflows, track progress, and maintain a single source of truth for projects.
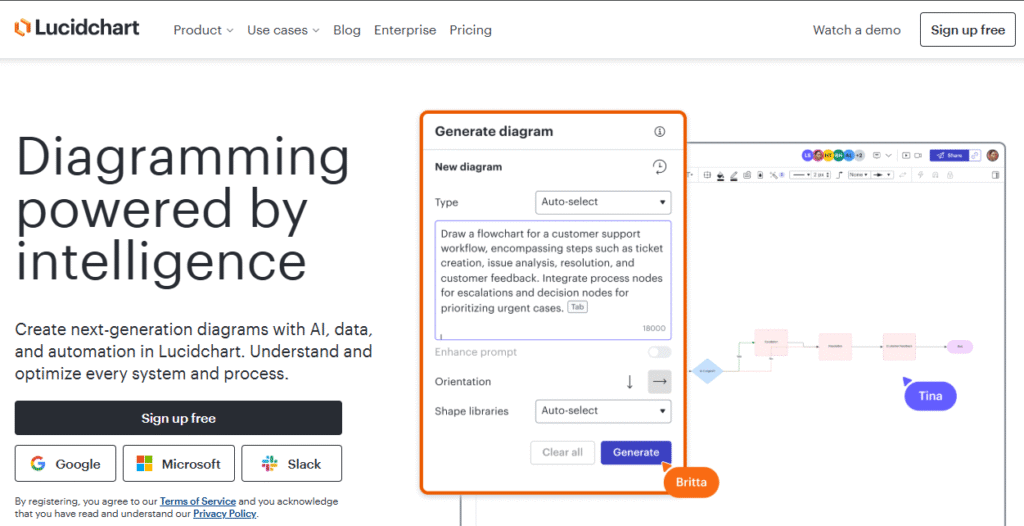
Lucidchart: Diagramming and Flowchart Tool
Lucidchart is a robust diagramming and flowchart tool used by business analysts to visually map out complex systems and keep the team on the same page.
It is a collaborative diagramming platform and allows people to visualize and share ideas, information, thoughts about processes.
Key Features of Lucidchart for Business Analysts:
- Flowcharting and Diagrams: By using Lucidchart, business analysts can develop flowcharts, wireframes process maps or organizational diagrams to visualize how information flows through the system or how decisions are being made.
- Team collaboration: With Lucidchart, you can work on the same diagram with your team mensch simultaneously making sure everyone is on the same page.
- Interoperability: Lucidchart works with other tools such as Google Workspace, Microsoft Office and Atlassian so analysts don’t have their workflow interrupted.
- Templates: Lucidchart offers a variety of customizable templates to kick-start your business analysis diagram.
Business analysts must document processes, systems, and workflows in a manner that is easy to understand and share.
SQL for Data Analysis
SQL for business analysts is an important skill for a data job.
SQL is a standard language for accessing databases, and it is used to extract, update, and analyze data stored in database systems.
Key Features of SQL for Business Analysts:
Data Querying: SQL permits analysts to query data from big databases, condition them, sort them and act upon for better understanding of the concept.
- Data manipulation: Analysts can reach directly into tables and execute operations like table join, view creation, record update etc using SQL.
- Advanced Queries: SQL can do “advanced” queries using subqueries, multiple tables, and advanced filtering operations such as GROUP BY and HAVING clauses.
- • Automation: SQL scripts can be automated on a schedule to guarantee data freshness for business analysts.
You need to have a good grasp of SQL as a business analyst who works with structured data, and you get great (for lack of a better term) query writing and manipulation powers.
Trello: Tasks and Workflows Management
Trello is such an amazing tool for business analysts to visually organize tasks and workflow by boards, lists, cards.
It comes in particularly handy for analysts who are juggling projects with several teams and deadlines, as it gives them a simple way to oversee progress and manage their workload.

Key Features of Trello for Business Analysts:
- Visual Task Management: With a board and card approach, Trello is great for tracking to-do’s and project milestones with a clear view of where everything stands.
- Collaboration: Trello lets you work collaboratively through comments, file attachments, and by assigning tasks to team members.
- Integration: Trello incorporates other tools, such as Slack, Google Drive and Jira — so you can keep all of your project details in one place.
- Customizable Workflows: Unlike Asana, which has only Flexible workflows (and Trello’s concept of the board), users can customize workflows by creating a board for each project or team and defining its project stages.
Conclusion
While Excel is a great tool for manipulating data, it is Tableau’s superior visualization capabilities and Power BI’s tight integration with Microsoft that enable business analysts to extract insights.
These tools allow business analyst to deliver actionable intelligence on which organizations can make sound enactment decisions.
Yet there are tools like Jira, Lucidchart and Trello that can not only facilitate project management experiences but also optimize workflows.
Through the proficiency of such weapons, BA tools can streamline their work processes possesses better decisions and edify complex analysis results.
On a planet ruled by data, the right chain of tools can make all the difference.
Wanna read more contents on business tools? Click here.
FAQs
To become a business analyst, start by learning key skills such as process analysis, data analysis and problem-solving. However, completing a degree in business, finance or IT helps. You can strengthen your skills with certifications such as CBAP or PMI-PBA and work experience in internships or entry-level roles. Must possess strong communication and analysis abilities.
A business intelligence (BI) analyst uses data to figure out market and business trends for companies to increase profits and efficiency. They applied BI tools to turn a data stream into intelligence driven by trends, patterns and performance metrics. They aim to deliver tactical advice derived from data, so that organizations can make their operations more efficient.
Business analysts leverage several tools that might include data analysis (such as Excel, Tableau), project management (JIRA, Asana) and communication (Slack, Microsoft Teams). Other popular tools might include process modelling software, like Visio and databases (like SQL which is used to store large data sets).